[Go Back]

Frequently Asked Questions


General Questions on Compatibility and Licensing

Are Tru-Traffic 10.0 files backward compatible with Tru-Traffic 9.0, are Tru-Traffic 9.0 files backward compatible with Tru-Traffic TS/PP 8.0, and are Tru-Traffic TS/PP 8.0 files backward compatible with TS/PP-Draft 7.0?

Yes. While the v7, v8, v9, and v10 files all differ somewhat, in reading the file, versions 7.0, 8.0 and 9.0 just ignore anything that they don't understand. (Similarly, ver. 10.0 will ignore anything that it doesn't understand from future versions).

As a result, if you open a v10 file using ver. 7.0, you'll see all the v7-related parameters and probably won't even be aware that there were some v10-, v9- and v8-specific parameters that are being ignored. Going the other direction, when you resave the v10 file from ver. 7.0 and reopen it with ver. 10.0, you may notice some differences, as resaving from ver. 7.0 will strip out any v10-, v9- and v8-specific parameters you'd set, effectively reverting those to default. The things that would get stripped include

There may be a few other things I'm not thinking of right now, but I think that's the complete list.

Does Tru-Traffic work on Windows 10?

Yes. Tru-Traffic 10.0 and 9.0 and Tru-Traffic TS/PP 8.0 have been tested on Windows 10 with no detected problems.

Does Tru-Traffic work on Windows Vista?

Yes. Versions 8.0 and 9.0 were developed on a Vista machine to better expose any incompatibilities. There was one minor incompatibility (which still affects versions 7.0 and prior): The online help did not work out of the box. The first time you invoke Help in TS/PP-Draft 7.0 (or below) on a Vista machine, the system warns you that this (old) style help file is not supported by default. It prompts you to download a legacy help component from the MS web site, and after that, the online help works without trouble. Version 8.0 uses the newer format help file.

Versions 8.0, 9.0 and 10.0 run on Windows 7, 8, and 10, Vista, XP, and 2000.

The cost of a license is a bit rich for our blood. May we get a discount in pricing?

The cost for Tru-Traffic licenses is set to be very competitive, considering all that is included in the software and the technical support. Sorry, I can't offer a further discount in pricing -- beyond discounts for multi-license purchases or for educational use only.

Many governments insist that they get the lowest pricing available, so if I offered discounts to anyone, I'd have to offer them to all public agencies. (Moreover, if any private firms managed to thereby get a discount, on argument that they're working on a publicly funded project, then their competitors would need one out of competitive fairness).

So offering discounted pricing practically amounts to merely lowering the price across the board. But the current pricing reflects the costs of development and technical support. The multi-license discount reflects the fact that the per-license cost of technical support goes down at sites with multiple users. Given those costs, of development (divided over the user base) and technical support, the pricing is already about as low as it can go.

Thank you for understanding.

We purchased a license for one of our offices. May we transfer it now to another office?

At present, no. Sorry. I used to permit this at no charge, but I now have to preclude by policy. It turns out that the cost of technical support for the new site can be fairly high and really must be covered for the new user(s). Eventually, I may be able to come up with a licensing and pricing policy to permit such transfers for a reasonable fee, but until then, they're no longer allowed by policy.

If we purchase a license for one of our offices, do we get the multi-license discount for licenses at our other offices?

No. Sorry. The multi-license discount reflects the fact that the per-license cost of technical support tends to be lower at sites with multiple users. As a result, it applies only to additional licenses used at a given physical site.

Thank you for understanding.

We have a license to a much older version, and it's cheaper to purchase an additional license than it is to upgrade our current license. May we just get an additional license instead?

The additional license that you purchase will be to the same, older version that you currently have. If you have multiple licenses that are currently to various different versions, the additional licenses will be to the oldest version that you currently have.

Special Procedures

I have separate diagram files for two intersecting arteries in separate files. How do I link them together at their common intersection?

Use the File:Open command to open the first diagram, then use the File:Merge:as New Diagrams... command to merge the second diagram with the first. Finally, to link the two diagrams together at their common intersection, open either the Outline View or the Network View, and drag the intersection from one diagram to the common intersection in the other diagram, linking "Everything" (see Linking Intersections in the online help).

How do I transfer my diagram to a document in my word-processor (or desk-top publisher or graphics presentation program)?

If your word processor supports pasting graphics from the Windows Clipboard, then the easiest way is to copy (using the Copy command under the Edit menu) your diagram to the Clipboard, then paste it in your word processor. If your word processor does not support pasting graphics files, then you might try reserving some white space on one page in your document, and set your Diagram Size and Margins so that when you print diagram, it fits in that white space. Then run that page through your printer a second time to print the document.

How do I transfer data between Tru-Traffic and Synchro?

Tru-Traffic and Synchro can share street, traffic, and signal data through a set of text files in the UTDF (Universal Traffic Data Format), either 2006 "combined file" or the older (5-file) version 2.1. Both Tru-Traffic and Synchro can read and write these files. For details on how to read or write these files with Tru-Traffic, see the section "Import/Export UTDF Files" in the online help. For additional information on how to read or write these files with Synchro, see the section "Importing/Exporting UTDF Files with Synchro" in the online help.

How do I work with multiple timing plans for my signalized network?

Use the drop-down menu button on the Tool Bar to add, delete, or select between timing plans.

If you prefer to keep your timing plans in separate files, there is a companion utility, CopyFromDgmFile, that simplifies the management of multiple timing plans. Its purpose is to transfer selected intersection or traffic signal parameters from one diagram file (*.Dgm) to another. You can change the common parameters within one diagram file, then use CopyFromDgmFile to apply those changes to other diagram files.

The CopyFromDgmFile program is in the same folder with Tru-Traffic. Its online help gives more details on how to use it.

How do I specify the schedule of the timing plans so only the appropriate trip logs are shown for the currently-selected timing plan?

It isn't necessary to specify the schedule. Instead, for each trip log, you can specify to which timing plan(s) it applies. This is easier than you might expect.

In the list of trip logs on the GPS Trip Logs page,

  1. Left click on the Start Time column header. This sorts all the trip logs by time of day.
  2. Left click on the first trip log to select it. Presumably, it will be a trip log collected in the morning that should apply to the AM timing plan.
  3. Hold the Shift key down and left click on the last trip log that also applies to the AM timing plan. If necessary, you may need to resize the window or scroll the list down so this trip log is visible. This selects the entire group of AM trip logs.
  4. Right click on the selected AM trip logs, and from the pop-up menu, choose Visible in Timing Plan: Selected: <AM timing plan> so the appropriate AM timing plan is checked.
  5. Repeat these steps as needed to associate the remaining trip logs with their corresponding timing plan(s).

If you have trip logs collected for timing plans with different schedules based on day of the week, (such as on normal weekdays vs. weekends and holidays), then before you perform step (4) listed above, left click on the Day column header. This sorts all the trip logs by the day of week, but leaves the already selected trip logs highlighted. After that, you may hold the Ctrl key down and left click on individual trip logs to exclude or include them into the mass selection. When you filtered out the inapplicable trip logs, you may perform step (4), right clicking on the remaining selection to associate those trip logs with their corresponding timing plan(s).

When you've completed these steps, only the applicable trip logs will be visible in each timing plan. As you toggle to different timing plans, the trip logs previously visible will be hidden, and the appropriate trip logs will automatically appear.

Some of the intersections are so closely spaced on the diagram that their text is overlapping and unreadable. What can I do?

In most cases, the best way to deal with this is to manipulate the Horizontal Scale and the Distance from the left margin to the first intersection to zoom in on the crowded section of the diagram. Tru-Traffic provides an easy way to do this: Move the mouse cursor between two intersections and left-drag a box around the crowded intersections or a section of the diagram. This changes the horizontal scale and the distance from the left margin to the first intersection to effectively zoom in on the selected intersections. In this mode, think of the diagram as spanning multiple pages. Use the Page Up & Page Down keys, or their corresponding buttons on the tool bar, to jump from page to page. When you print, you have the option to print one or all pages. There should be enough overlap between the pages that you can tape them together to make one long diagram.

If you'd prefer the diagram fit all on one window or page, a combination of other options should help:

  1. Set the diagram Width to be as wide as necessary to separate the crowded intersections. If you want to print the diagram, set the width to the full width of the page. If you don't care about printing, set the width to be even wider. As you change the diagram width, Tru-Traffic adjusts the Horizontal Scale, if it's not locked, to fill up the entire width of the diagram — the boundary intersections will be at the edges of the diagram without any extra space.
  2. Choose a smaller font size for the overlapping text. For a very small font sizes, set the font name to "Small Fonts."
  3. When the text at the bottom of the diagram is overlapping, allow the text to straddle multiple lines using the controls on the Preferences: Layout: Misc. page.
How do I print my diagram on 11" × 17" paper?

In the Diagram/Arterial parameters, under the Diagram tab, set the size of the diagram to, say, 9" × 15", depending on what size margins you prefer.

How do I import an Excel spreadsheet of travel time runs (GPS points, speeds, heading) into Tru-Traffic?

From Excel, you'll probably want to use either .TSV or .CSV.

If the (non-Excel) program you're exporting from allows you to export GPX files and gives you a choice of GPX version, choose version 1.0, not 1.1, as the 1.0 version includes extra information (speed and heading) that is useful in analyzing trip logs in Tru-Traffic.

I have a Garmin GPS receiver with only a USB interface (or while it may have a serial interface, I have only the USB cable). Will this work with Tru-Traffic?

Yes, it will work, but only indirectly, not directly. Without the serial cable, the only choices that I know of are to either

  1. Download the tracks from the GPS receiver using some other software to, say, a .GPX file, then import that into Tru-Traffic, or
  2. Connect the GPS receiver to Tru-Traffic using a serial port emulator and let Tru-Traffic record the trip logs using the NMEA interface over the emulated serial port. (Note that the NMEA interface does not support downloading prerecorded tracks).

For the first option, I know of four software packages, any one of which should do the trick:

Before choosing this option, you should be aware of some its disadvantages. The figure below, taken from the User's Manual illustrates the most easily observed disadvantage: from 2 to 5 mph of random noise in the speed. The associated discussion in the user's manual describes the cause and consequences in more detail. As of this writing, the figure is on page 54 in the user's manual.

Noise in calculated GPS speed.

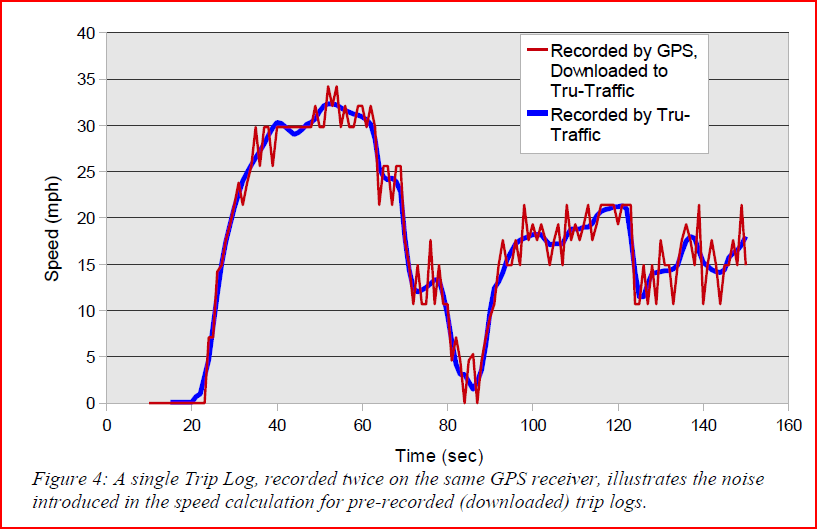
The concern here can extend beyond mere cosmetics. When calculating fuel consumption and emissions using a "modal" FC&E model, such as CMEM or MICRO2, this noise is treated as spurious accelerations and braking, artificially increasing the calculated fuel consumption and emissions. When viewing the graph, your eye can easily look past the noise and find a central trend line through the speed measurements. But the modal FC&E models assume that the given speed is measured accurately, so they include the fuel consumption resulting from such erratic driving.

For the second option, I know of three serial emulators, any of which should do the trick:

Multiple users, including me, have successfully used Franson's GpsGate. I know of only one user that has used DeLorme Serial Emulator successfully with a Garmin GPS receiver, and I haven't tried it myself.

Modelling Special Situations

How do I model a signalized network?

Think of the network as a series of intersecting arteries. You'll need to create an Arterial Diagram for each artery in the network, and link them at their common intersections. See the online tutorial Creating a Network for details.

How do I model a school zone (with a reduced speed) beginning mid block?

Tru-Traffic allows you to change the downstream band speed at signals, but not between signals. There are two options here:

  1. Insert phantom intersections at the boundaries of the school zone (e.g., at 150 ft from the actual intersection). Set the through split along the artery to be 100% of the cycle length, and name the intersections "SchZone" or "SZ" so you'll know what it is. Then set the band speed downstream of the phantom intersections to the lower speed (e.g., 20 mph) in the appropriate directions of travel. This will allow you to see a band on the diagram with a kink in it marking the change of speed.
  2. Calculate the average speed for the two links that include the school zone and set the band speed to that. This will give a straight band on the diagram along the entire link, but the slope will correspond to the correct travel time. The average speed is the link distance divided by the total link travel time, so this works out to

AvgSpeed = Distance / ( SZDistance/SZSpeed + (Distance - SZDistance)/Speed )

where

Distance is the total link length or distance between intersections

SZDistance is the length of the school zone within the link (e.g., 150 ft.)

SZSpeed is the speed within the school zone (e.g., 20 mph)

Speed is the speed in the link outside the school zone

The units have to be converted to ensure consistency.

How do I model a diamond interchange? or Is there an easy way to model two nearby signals working off a common controller?

The easiest way to work with a diamond interchange is to enter it as two, nearby intersections with "linked" Offsets. This way, the Offsets at the two intersections will move "as one." For example, suppose you have an North-South artery with a diamond interchange. Then at the first intersection (at the Eastbound on- and off-ramps), set the Protected Turn Phase Sequence to "None" in the Northbound direction, and to "Lead" (or "Lag") in the Southbound direction. If the signal is set so that the through traffic has a constant green after passing under the overpass, then set the Southbound through Split to 100%. Similarly, at the second intersection (at the Westbound on- and off-ramps) set the protected cross-traffic turn phase to "Lead" (or "Lag") in the Northbound direction and to "None" Southbound direction, and, if appropriate, set the Northbound through Split to 100%. Start by setting both Offsets to zero, link the intersections (Offsets only), then set the Offset (at either intersection) to the correct value. If the Offset Reference Point is set to "Start of second through movement" at the two intersections and one (or both) have a "Lead" protected cross-traffic turn phase, then start by setting the Offset equal to the turn Split at whichever intersection(s) has/have the "Lead" protected turn phase before linking the intersections.

If you wish, the nearby intersections can have other signal timings linked in addition to the Offsets: Offset Reference Points, Adjusted Cycle Length, Splits (and whether the splits are Fixed), Protected Turn and Pedestrian Phase Sequences, and With-traffic Turn on Red options. In this case, Tru-Traffic ensures that all timing parameters for the two intersections remain identical. You can change any one of these parameters at either intersection and Tru-Traffic makes the equivalent change at the other.

How do I set up time-space diagrams for three arteries that intersect around a triangular block? or
How do I handle an artery which changes directions as it runs through my grid?

Suppose you have three arteries, A, B, and C, intersecting around a triangular block as shown in the figure below.

A triangular block

In A's arterial diagram, set the Forward Direction to North. Set B's to East.

Set C's Forward Direction to either North or East, your choice. In the C arterial diagram, at the A intersection, locally override the Forward Direction setting it to East, and at the B intersection, locally override the Forward Direction setting it to North.

Link everything between the arterial diagrams at their common intersections.

How do I declare a split phase, or phasing in which the northbound and southbound phases do not overlap?

With version 5.0, set the northbound Protected Turn Phase Sequence to "Split-Lead" and that in the southbound direction to "Split-Lag". Set the northbound and southbound either through or turning Splits to their correct values. TS/PP-Draft 5.0 automatically ensures that the through and left phases overlap (sharing the same splits, phase numbers, and clearance times).

With version 4.0, Set the northbound Protected Turn Phase Sequence to "Lead", and that in the southbound direction to "Lag". Set the northbound and southbound through Splits to their correct values. Make sure that the northbound through split is equal to the northbound cross-traffic turn split and that the southbound through split is equal to the southbound cross-traffic turn split.

See the discussion of Non-Consecutive Split Phases after the following question for information on how to declare northbound and southbound movements which are not consecutive (that is, the northbound movements are followed by the westbound movements, and the southbound movements are followed by the eastbound movements.

How do I set the phase sequence to indicate that the northbound phase and the southbound phase are not consecutive?

With TS/PP-Draft version 7.0 and later, set the phase sequences on both the artery and the cross street to Split-Lead and Split-Lag, then use the phase numbers to specify the actual order in which the phases are served.

For example, suppose the approaches are served in the order NB, EB, SB, WB. (Note that NB and SB are not consecutive, and EB and WB likewise). To specify this phasing, set the NB and EB phase sequences to Split-Lead (and the SB and WB phase sequences will then be Split-Lag). Then set the phase numbers to

On each approach, you'll set these phase numbers for both the through and the protected turn, but this should be automatic provided you're using Split-Lead/Split-Lag phasing.

With versions prior to 7.0, TS/PP-Draft didn't have a straight-forward way to do this, but you can trick TS/PP-Draft into simulating this on the diagram. To do this, set the northbound Protected Turn Phase Sequence to "Lead", and that in the southbound direction to "Lag". Set the northbound and southbound through Splits to their correct values. Then set the northbound cross-traffic turn Split to the sum of the northbound through Split and the though Split of the phase (East or West) that immediately follows the northbound phase. Similarly, set the southbound turning Split to the sum of the southbound through Split and the though Split of the phase (East or West) that immediately follows the northbound phase. For example, if the approaches are served in the order northbound, eastbound, southbound, then westbound, then both the North- and southbound turn Splits should be equal to their respective though Splits plus the eastbound through Split. When you use this trick, TS/PP-Draft will give incorrect values for the North- and southbound turning Splits in the Intersection Parameters dialog and on the reports of the parameters, but at least the diagram will look correct.

See the discussion of Split Phases after the previous question for information on how to declare consecutive northbound and southbound through movements which do not overlap

How do I declare an "overlapped" turn phase, that is, a cross-traffic turn movement served by both leading and lagging phases?

Earlier versions of TS/PP-Draft had no straight-forward way to do this. Now you can simply set the Protected Turn Phase Sequence to "Lead+Lag."

I have a two-way artery that splits into a pair of one-way arteries which then merge back into a two-way artery. How do I model this?

Perhaps the easiest way is, in the Intersection Parameters for the intersections in the divided section of the artery, designate that the signals control traffic in one direction only. This option is available starting with version 8.0. Versions of TS/PP-Draft prior to 8.0 don't have a straight-forward way to do this, but you can trick TS/PP-Draft into simulating this on the diagram. There are two methods.

Consider the artery laid out as in the figure. Example of 2-way to 1-way back to 2-way

Method A: Probably the best method is to create two diagrams for the same artery. One is for the eastbound leg and is called "Mostly Eastbound Artery" for this discussion. The other is for the westbound leg and is called "Mostly Westbound Artery". For the most part, they have common intersections, but each one has a signal in the middle that is not shared by the other diagram. The key points are:

The biggest annoyances with this method are that

Method B: The other method is to create just one diagram for the artery, which is two-way and has both of the two signals in the middle, which are really on separate, one-way arteries (one eastbound and one westbound). At these signals, we need to play a trick with the Green Band Action. At the "eastbound Intersection", set the Green Band Action in the westbound direction to "Continue." This way, the westbound band simply ignores the signal there and continues on through unaffected. Similarly, at the "westbound Intersection", set the Green Band Action in the eastbound direction to "Continue." Starting with version 8.0, you can set these specific intersections to be controlling traffic in just one direction in View: Intersection Parameters: Name, etc.: Control Traffic.

This method also has some annoyances:

Troubleshooting

The "Lead-Lead" intersections are drawn in the wrong order with respect to the "Lead-Lag" intersections on my diagram. Can you explain this?

Sure. What you're thinking of as green time is actually the red time, and vice versa. The signals in Tru-Traffic's diagrams may be drawn differently from those that you're used to. They're not like PASSER's! In Tru-Traffic, the green time is shown in the background color and the red time is shown in the foreground color. This way, the green time (which does not impede traffic flow) looks just the same as the space between the intersections (which also does not impede traffic flow), and you can think of the foreground color or red time (the only thing that does impede traffic flow) as obstacles or barriers to the through traffic.

What does this "Splits' sum not equal to Cycle Length" warning mean?

This warning message occurs when the sum of the Splits (through, protected turn, and exclusive pedestrian) is not equal to the Cycle Length. There are three common causes of this warning:

I have a "Lead-None" intersection which is being drawn as a "Lead-Lag" intersection on the diagram.

You probably have Splits whose sum is not equal to the Cycle Length. As explained in answer to the previous question, the most common cause of this is forgetting that the through Split in the direction with the protected cross-traffic turn phase is the total through Split in that direction, that is, it should be equal to the sum of the opposing through Split and the accompanying cross-traffic turn Split. You can think of these two numbers as "cross sums": While viewing the Splits in the intersection parameters window, the through and turning Splits for opposing directions of travel are displayed in the four corners of a box. Regardless of the Turn Phase Sequences (Lead, Lag, or None) the sums of the Splits in opposing corners of the box should always be equal. That is, cross sums should be equal!

Actually, an exception to this rule occurs when the cross-traffic Turn Phase Sequence is "Lead+Lag," in which case there are two cross-traffic turn phases, one leading and one lagging the opposing through, and each will have its own Split. In this case, you'll need to sum the two corresponding turn Splits before applying the rule.

I can't connect to my GPS receiver through my USB-to-Serial adapter.

Version 5.0 had a problem working with at least some USB-to-Serial adapters, but this problem was fixed in version 6.0.

Although the different brands of USB-to-Serial adapters are not the same, every one that I'm aware of works with Tru-Traffic. I'm not aware of any brands that don't work. If it turns out that yours really doesn't work with Tru-Traffic (but works fine with other programs), I'll swap you, as I'd like to get my hands on one that doesn't work so I can use it for testing and debugging. If you don't want to swap, let me know what model you have, and I'll buy one for myself.

To date, every time a user has reported this problem with version 6.0 and above, we've tracked it down to something else:

While tracking with the GPS receiver, I don't see my current position on the diagram. or
My recorded trip logs don't appear on the diagram.

You need to set the Geographic Positions of the intersections. To display your current position on a diagram or the Network View, Tru-Traffic needs two pieces of information: (1) where you are now geographically, and (2) where the intersections are geographically. Comparing these two, Tru-Traffic can tell where you are in relation to the signals on the diagram or the Network View and show your position. The same is true for displaying trip logs on a diagram or the Network View, with the exception that the your geographic position is not "current." At trip log is a recorded series of geographic positions each with a time stamp.

The GPS receiver provides the first piece of information, where you are now geographically, whenever you're tracking.

You must provide the second piece of information, where the intersections are geographically, by clicking the Get Position button in the Intersection Parameters window. If you do this while you're tracking with the GPS receiver, you may then click the Add GPS Measurement button to take the current GPS reading as a measurement of the intersection's position. Otherwise, you may click the Add Position Manually button to manually enter the geographic coordinates of the center of the intersection.

For the purposes of displaying recorded trip logs as trajectories on a diagram or on the Network View, or for generating a Travel Time & Delay Report, it doesn't matter which order these two pieces of information are collected. But for the purpose of seeing your current position displayed on the diagram or on the Network View while tracking with the GPS receiver, the intersections' geographic positions must be collected first.

While tracking with the GPS receiver, the marker on the diagram shows me at the wrong point in the cycle. For example, it shows me passing through a signal just after it turned red, but actually I was well in the green time.

Assuming the Cycle Length and Splits in Tru-Traffic are set correctly, you need to synchronize the clocks between the traffic signals and the GPS satellites. Effectively, this tells the program when, in absolute clock time, the network-wide zero occurs in the signal cycle.

The Travel Time & Delay Report says that my recorded trip log stops before an intersection then resumes at the next intersection downstream. or
The TT&D Report says that my trip log started at intersection X, but it actually started at the previous intersection upstream.

The general cause of this problem is that your trip log passes too far from where the Geographic Position of the center of the intersection is declared to be located, so Tru-Traffic thinks that the trip bypassed the intersection (e.g., along a side street or through a parking lot). Any of a number of things can cause this, and each has its own solution. Most of them can be detected by carefully inspecting the Network View. We'll consider them step by step.

The two figures below illustrate some common errors in specifying geographic coordinates and in recorded trip logs, errors which cause problems in generating the Travel Time & Delay Report and Plots from Trip Logs. The game here is that a run must pass through a red circle in order for the software to conclude that the run passed through an intersection. Furthermore, a run must pass through at least two consecutive red circles to be counted as having "entered the artery."

Examples of problems with geographic coordiantes

Examples of problems with trip logs

  1. Open the Network View. If you see the trip log plotted on the Network View (as a thin line, blue, red or purple), then skip to Step 4.
  2. Right-click on the Network View. If the command "Layout Grid with Geographic Coordinates" is grayed out, then there is one or more intersections whose Geographic Positions have not yet been specified. To display your trip logs on a diagram or the Network View, Tru-Traffic needs two pieces of information: (a) your geographic position at a series of times, and (b) where the intersections are geographically. Comparing these two, Tru-Traffic can tell where you travelled in relation to the signals on the diagram and show your path.

The trip logs provide the first piece of information, your geographic position at a series of times.

You must provide the second piece of information, where the intersections are geographically. The easiest way is using Google Earth, as explained in a chapter of the User's Manual. Alternatively, you can enter them by clicking the Get Position button in the Intersection Parameters window. If you do this while you're tracking with the GPS receiver, you may then click the Add GPS Measurement button to take the current GPS reading as a measurement of the intersection's position. Otherwise, you may click the Add Position Manually button to manually enter the geographic coordinates of the center of the intersection.

For the purposes of displaying recorded trip logs as trajectories on a diagram or on the Network View, or for generating a Travel Time & Delay Report, it doesn't matter which order these two pieces of information are collected. But for the purpose of seeing your current position displayed on the diagram or on the Network View while tracking with the GPS receiver, the intersections' geographic coordinates must be collected first.

  1. Right-click on the Network View and choose "Layout Grid with Geographic Coordinates." This might solve the problem, but if not, proceed to the next step.
  2. Since the trip log is visible in the Network View, we know that it's a least reasonably close to the declared positions of the center of the intersections. The problem, then, is it's not quite close enough. Make sure that the nodes in the Network View are roughly where you expect them with respect to the trip log. If there's one outlying node, then it's possible that the geographic position of that intersection is incorrectly specified, either because the wrong value was entered or because you took a GPS reading on one side of the intersection but forgot to take a corresponding reading on the opposite side. See Step 2 for more information about specifying the geographic positions of the intersections.
  3. Right-click on the Network View and check the item "Show Intersection Extents" to view the effective extent of the intersections. This is a circle centered at the intersection with a radius equal to the half-width of the intersection. A trip log must cross this region to count as passing through the intersection. Viewing the extent makes it easier to diagnose why a trip log is either skipping an intersection or passing through one twice. You can also detect when an extent is too large, usually due to a bad or misplaced coordinate measurement.
  4. Make sure the Number of Lanes and Lane Widths are set correctly at each intersection for each direction of travel along the artery. Tru-Traffic uses these numbers to estimate the intersection width.
  5. If the problem still persists, it might be that there's a fairly wide median unaccounted for in the intersection width estimate. At present, Tru-Traffic has no provision for you to enter the median width directly, but you can effectively enter the total intersection width. Do this by using the GPS receiver connected to the computer and clicking the Add GPS Measurement button to add measurements for the geographic position of the center of the intersection, as discussed in Step 2. Add the measurements in pairs, straddling the intersection. It's usually best to walk the four corners of the intersection, adding the GPS reading at each corner as a measurement. If you prefer to do this while riding along in a vehicle, be sure the vehicle is driving along the outside lane in each direction.
  6. If the problem still persists, and if you manually entered the geographic position of the intersections, then there are several likely errors.
  1. It might be that you took GPS measurements for the geographic position of the intersections while travelling in one direction, but forgot to match these with GPS measurements while travelling in the opposite direction. If this is the case, it should be evident in the display of the trip log on the Network View. If the intersection positions are specified with just one GPS reading, there will be an overall bias, and trip logs in both directions of travel will probably be off to one side — the same side — of the node centers. If this is the case, you'll need to travel the artery in the opposite direction, specifying the geographic position of each intersection using the GPS receiver, as discussed in Steps 2 and 6. Remember that it's best to add GPS readings in pairs that straddle the intersection center.
  2. It might be that the geographic position of the intersections are specified using a different geodetic datum than the trip log. Most GPS receivers use WGS-84 by default, and if you manually the geographic position of the intersections, you may have used a different geodetic datum. If this is the case, it should be evident in the display of the trip log on the Network View. Does the trip log pass each node near its center or on the correct side of the node, depending on the Drive Rule? If the intersection positions are in a different geodetic datum than the trip log, there will be an overall bias, and trip logs in both directions of travel will probably be off to one side — the same side — of the node centers. If this is the case, you'll need to respecify the geographic position of each intersection using the GPS receiver, as discussed in Steps 2 and 6. This will ensure you're using the same geodetic datum for both the positions and the trip logs. It's best to add GPS readings in pairs that straddle the intersection center.
  3. It might be that the geographic position of the intersections are specified with insufficient precision. A precision of about 0.0002 minutes of arc (0.012 seconds of arc), which corresponds to about 1 foot (30.5 cm) north and south, should be sufficient. If this is the problem, it should also be evident in the display of the trip log on the Network View. The trip log will tend to pass fairly far from the center of each node, missing it by varying distances, sometimes passing to the right and other times passing to the left. If this is the case, you'll need to respecify the geographic position of each intersection using sufficient precision.
  1. If the problem still persists, I probably haven't made Tru-Traffic sufficiently tolerant of the imprecision of GPS readings. Please let me know, and send me your diagram data file, so I can fix this problem.
In my Travel Time & Delay Report, the "Stopped Delay" is larger than the (total) "Delay". How is this possible?

Because of the way it's defined, the (total) Delay can include compensating time — time spent traveling faster than the design speed, thereby making up for time lost earlier in the run or even running ahead of schedule. If your trip log arrives at the next node ahead of schedule, then the node-to-node Delay appears as a negative number.

The Stopped Delay, in contrast, can never be negative by definition.

Even when the Delay exceeds the Stopped Delay, it can still be unrealistically small. In either case, to prevent this situation, make sure you set the Design Speed and the Design Distance to their proper values for each intersection. Recall that the Delay is calculated as

Delay = TT - RT

which is difference between the actual, measured Travel Time and the user-specified "running time," which is given by

RT = (Design Distance) / (Design Speed)

Thus, a proper calculation of the Delay depends on your entering realistic values for the Design Distance and Design Speed. In both cases, you'll probably want to use relevant trip logs to calculate the best estimate. To do this, click the Get from Trip Logs button next to the Design Distance entry box and click the "..." button next to the Design Speed entry box. In the case of the Design Distance, you'll usually want to take the average of the trip logs, after excluding any far-fetched outliers. In the case of the Design Speed, however, you'll often want to take the average of just the fastest few trip logs, or maybe even the fastest trip log, on theory that the slower ones include an appreciable delay and shouldn't be used as a baseline for estimates of the true delay.

I've just recorded some trip logs, but I don't see them on the Network View.

There are several things that can cause this.

  1. Make sure you've set the Geographic Positions of the intersections. To display your trip logs on a diagram or the Network View, Tru-Traffic needs two pieces of information: (1) your geographic position at a series of times, and (2) where the intersections are geographically. Comparing these two, Tru-Traffic can tell where you travelled in relation to the signals on the diagram and show your path.

The trip logs provide the first piece of information, your geographic position at a series of times.

You must provide the second piece of information, where the intersections are geographically, by clicking the Get Position button in the Intersection Parameters window. If you do this while you're tracking with the GPS receiver, you may then click the Add GPS Measurement button to take the current GPS reading as a measurement of the intersection's position. Otherwise, you may click the Add Position Manually button to manually enter the geographic coordinates of the center of the intersection.

For the purposes of displaying recorded trip logs as trajectories on a diagram or on the Network View, or for generating a Travel Time & Delay Report, it doesn't matter which order these two pieces of information are collected. But for the purpose of seeing your current position displayed on the diagram or on the Network View while tracking with the GPS receiver, the intersections' geographic positions must be collected first.

  1. Right-click on the Network View and choose "Layout Grid with Geographic Coordinates." If this command is grayed out, then there is one or more intersections whose Geographic Positions have not yet been specified. (See item (1) above).
When I import UTDF files, my artery is split into two or more sub-arteries. What should I do?

I know of several things that can cause this.

  1. Make sure you're using the current version of Tru-Traffic. Version 4.0.0.11 fixed a problem that could occur at Y intersections — in tracing the artery through the intersection, the program could sometimes have trouble choosing which two legs have the through movements and which one is the side street. You can check which version of Tru-Traffic you're using with the About command in the Help Menu. Then check here for the latest version.
  2. If you've divided your network into "zones" in Synchro, and you're writing just one zone to the UTDF files, make sure every node (including bends!) along the artery is in that zone. It's easy to forget to assign a zone to a bend, and in this case, Synchro won't include the bends as declared nodes in the Layout file, but they'll be referenced as connecting nodes of the neighboring intersections. Tru-Traffic will find some intersections referencing nonexistent (or undeclared) nodes, and will have to split the artery there.
  3. A problem can arise at a K intersection. Whenever Tru-Traffic encounters a 4-legged intersection in a UTDF file, it assumes that the movements from each approach to adjacent legs are turning movements. This assumption isn't correct at a K intersection, and the program will end up splitting an artery there. I haven't decided how to fix this one yet, and if you're interested in discussing it with me, I would welcome your thoughts.
Why are the volumes all zero when I import UTDF files?

When you import UTDF files, near the bottom of the window you have to select a range of times over which volume counts will be averaged. If none of the volume counts in the UTDF Volume file fall within that range, then no volumes are imported. To avoid the problem, you can choose an extreme range (e.g., use all counts during the past 10 years or something like that) to ensure that whatever counts are in the file will be included.

Version 4.0.0.11 of the program is modified so this shouldn't be a problem — the program will detect when all counts in the file lie outside the selected range and offers to adjust the range to ensure that the counts are imported.

When I import UTDF files, the streets don't have names.

Make sure the Layout data file is a .CSV (comma separated variable) style file. The .DAT-style file for Layout data doesn't contain any street names in it, only the .CSV-style file has street names.

When I try to view a report, I get an error message "The filename, directory name, or volume label syntax is incorrect." or
When I try to print a diagram or a report, I get an error message "The filename, directory name, or volume label syntax is incorrect."

You probably don't have a printer driver installed for your operating system. To generate a preview of the report, Tru-Traffic must query the printer driver for some properties of your printer. If the operating system has no printer installed, these queries return this error message.

To install a printer driver, click on the My Computer icon on the desktop, and select Printers: Add Printer.

I can see buttons on the Tool Bar, but they're blank — they don't have any icons on them.

You need to update the "Common Controls Library" of your operating system. This is in the file Comctl32.DLL, and it's usually in either the C:\Windows\System or C:\Windows\System32 folder. TS/PP-Draft 4.0 requires this file to be version 4.72.3110.1 or later. You can check the version by finding the file in the Windows Explorer, right-clicking on it and selecting Properties then Version.

The article http://support.microsoft.com/support/kb/articles/Q186/1/76.asp explains how to update this file, if necessary.

I can see the green bands on the screen, but not on the print-out of the diagram.

This seems to result from a quirk in some printer drivers. It might be a funny interaction in some black & white printer drivers between the drawing of dotted lines and emulating color. When a printer driver responds to a command to draw a colored line on a black & white printer, it typically draws it as a shade of gray by "dithering" the dots along the line, selectively removing some black dots to emulate gray. If the line is to be drawn as a dotted line (as the green band lines are), then there's an additional removal of dots to produce the dotted effect. It seems that with some printer drivers, these two stages of dot-removal conspire together to effectively remove all dots, resulting in no line drawn at all!

You should first try updating your printer driver. If this doesn't solve the problem, you can work around it by changing the color of the beginning and end of the green bands to black using the Color page of the Options dialog. (If you hold down the Control key, you can select and edit both of these colors simultaneously).

One consequence of doing this is that the screen diagram will now also show black lines instead of colored for the green bands. If this is a drawback to you, then there are several other things you can try: Most black & white printer drivers let you change settings that have to do with how they print colors, and some printers support more than one printer "language" (for example, many HP printers can support "PCL" and "PostScript," although the PostScript support often requires a separate module). You might try changing these options to see if there's a configuration that allows for printing of the colored, dotted lines on the diagram.

To play with the printer driver's color emulation settings or other graphics settings,

  1. Click the Windows "Start" button — usually in the lower left corner of the screen.
  2. Select Settings: Printer.
  3. Right click on the printer you're using and select Properties.
  4. From here on, you're kind of on your own because what you see will depend on which printer and printer driver your system is using. But poking around, you might find something about graphics, dithering or gray scaling on, say, the Graphics or Color page. If you do, you might try combinations of whatever options are available, then try printing again to see if you can see the bands. Possibly even changing the printer resolution will solve the problem.
  5. You should keep track of what settings you change so you can restore them later if necessary.

If your printer can support more than one language, then you might try using using a printer driver for the other language.

  1. Click the Windows "Start" button — usually in the lower left corner of the screen.
  2. Select Settings: Printer.
  3. If there isn't already a printer driver for the other language, double click on Add Printer to add the additional driver. You should be able to follow the instructions from there to find the other driver and get it installed.
  4. Right click on the printer driver for the other language and select Set as Default. Note that it isn't really necessary to set this printer to the default, but if you don't, you'll need to remember to specify this printer each time you print the diagram.
  5. Try printing again to see if you can see the bands.
I can't run Tru-Traffic. When I try to start it, it immediately closes. Or it warns me that it's running in Demo mode, but closes as soon as I click OK.

Versions 6.0 and above need a printer driver installed for initialization of the report generator. Make sure you have a printer driver installed. If you don't have a printer, then "install" any printer driver to a File (instead of on the network or parallel or serial port). I like installing a Postscript printer (e.g., the HP 4550 Color PS) to a file because it gives me an easy way to create pdf files.

One user reported this problem even though he already had a printer installed. It turned out that when he selected a different printer as the default, everything worked just fine. We're not sure what was wrong with the original default printer. Also, when he installed a Postscript printer to a file and selected that as the default, everything worked fine.